ヘルプ -その2-
citation
パッケージを引用する場合の情報を提供する。
# パッケージの著作情報のテンプレート
citation()
##
## To cite R in publications use:
##
## R Core Team (2016). R: A language and environment for
## statistical computing. R Foundation for Statistical Computing,
## Vienna, Austria. URL https://www.R-project.org/.
##
## A BibTeX entry for LaTeX users is
##
## @Manual{,
## title = {R: A Language and Environment for Statistical Computing},
## author = {{R Core Team}},
## organization = {R Foundation for Statistical Computing},
## address = {Vienna, Austria},
## year = {2016},
## url = {https://www.R-project.org/},
## }
##
## We have invested a lot of time and effort in creating R, please
## cite it when using it for data analysis. See also
## 'citation("pkgname")' for citing R packages.# knitr
citation("knitr")##
## To cite the 'knitr' package in publications use:
##
## Yihui Xie (2016). knitr: A General-Purpose Package for Dynamic
## Report Generation in R. R package version 1.12.3.
##
## Yihui Xie (2015) Dynamic Documents with R and knitr. 2nd
## edition. Chapman and Hall/CRC. ISBN 978-1498716963
##
## Yihui Xie (2014) knitr: A Comprehensive Tool for Reproducible
## Research in R. In Victoria Stodden, Friedrich Leisch and Roger
## D. Peng, editors, Implementing Reproducible Computational
## Research. Chapman and Hall/CRC. ISBN 978-1466561595# パッケージのタイトル情報を参照
x <- citation("knitr")
x$title[1]## [[1]]
## [1] "knitr: A General-Purpose Package for Dynamic Report Generation in R"demo
引数に指定した関数のデモが表示される。
# グラフに数式を表示する場合などに確認
demo(plotmath)
##
##
## demo(plotmath)
## ---- ~~~~~~~~
##
## > # Copyright (C) 2002-2009 The R Core Team
## >
## > require(datasets)
##
## > require(grDevices); require(graphics)
##
## > ## --- "math annotation" in plots :
## >
## > ######
## > # create tables of mathematical annotation functionality
## > ######
## > make.table <- function(nr, nc) {
## + savepar <- par(mar=rep(0, 4), pty="s")
## + plot(c(0, nc*2 + 1), c(0, -(nr + 1)),
## + type="n", xlab="", ylab="", axes=FALSE)
## + savepar
## + }
##
## > get.r <- function(i, nr) {
## + i %% nr + 1
## + }
##
## > get.c <- function(i, nr) {
## + i %/% nr + 1
## + }
##
## > draw.title.cell <- function(title, i, nr) {
## + r <- get.r(i, nr)
## + c <- get.c(i, nr)
## + text(2*c - .5, -r, title)
## + rect((2*(c - 1) + .5), -(r - .5), (2*c + .5), -(r + .5))
## + }
##
## > draw.plotmath.cell <- function(expr, i, nr, string = NULL) {
## + r <- get.r(i, nr)
## + c <- get.c(i, nr)
## + if (is.null(string)) {
## + string <- deparse(expr)
## + string <- substr(string, 12, nchar(string) - 1)
## + }
## + text((2*(c - 1) + 1), -r, string, col="grey")
## + text((2*c), -r, expr, adj=c(.5,.5))
## + rect((2*(c - 1) + .5), -(r - .5), (2*c + .5), -(r + .5), border="grey")
## + }
##
## > nr <- 20
##
## > nc <- 2
##
## > oldpar <- make.table(nr, nc)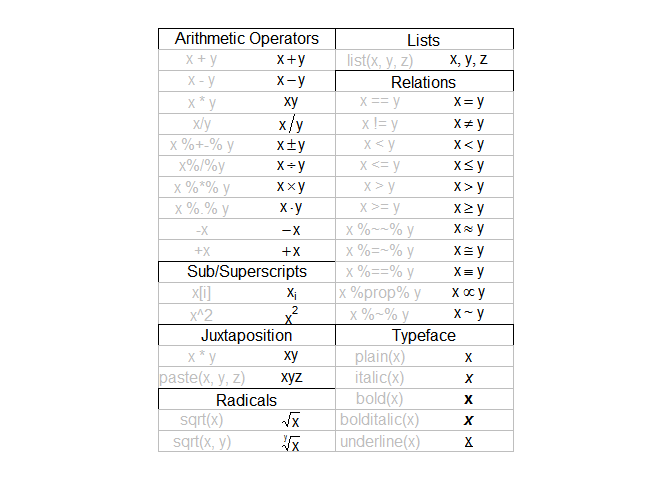
##
## > i <- 0
##
## > draw.title.cell("Arithmetic Operators", i, nr); i <- i + 1
##
## > draw.plotmath.cell(expression(x + y), i, nr); i <- i + 1
##
## > draw.plotmath.cell(expression(x - y), i, nr); i <- i + 1
##
## > draw.plotmath.cell(expression(x * y), i, nr); i <- i + 1
##
## > draw.plotmath.cell(expression(x / y), i, nr); i <- i + 1
##
## > draw.plotmath.cell(expression(x %+-% y), i, nr); i <- i + 1
##
## > draw.plotmath.cell(expression(x %/% y), i, nr); i <- i + 1
##
## > draw.plotmath.cell(expression(x %*% y), i, nr); i <- i + 1
##
## > draw.plotmath.cell(expression(x %.% y), i, nr); i <- i + 1
##
## > draw.plotmath.cell(expression(-x), i, nr); i <- i + 1
##
## > draw.plotmath.cell(expression(+x), i, nr); i <- i + 1
##
## > draw.title.cell("Sub/Superscripts", i, nr); i <- i + 1
##
## > draw.plotmath.cell(expression(x[i]), i, nr); i <- i + 1
##
## > draw.plotmath.cell(expression(x^2), i, nr); i <- i + 1
##
## > draw.title.cell("Juxtaposition", i, nr); i <- i + 1
##
## > draw.plotmath.cell(expression(x * y), i, nr); i <- i + 1
##
## > draw.plotmath.cell(expression(paste(x, y, z)), i, nr); i <- i + 1
##
## > draw.title.cell("Radicals", i, nr); i <- i + 1
##
## > draw.plotmath.cell(expression(sqrt(x)), i, nr); i <- i + 1
##
## > draw.plotmath.cell(expression(sqrt(x, y)), i, nr); i <- i + 1
##
## > draw.title.cell("Lists", i, nr); i <- i + 1
##
## > draw.plotmath.cell(expression(list(x, y, z)), i, nr); i <- i + 1
##
## > draw.title.cell("Relations", i, nr); i <- i + 1
##
## > draw.plotmath.cell(expression(x == y), i, nr); i <- i + 1
##
## > draw.plotmath.cell(expression(x != y), i, nr); i <- i + 1
##
## > draw.plotmath.cell(expression(x < y), i, nr); i <- i + 1
##
## > draw.plotmath.cell(expression(x <= y), i, nr); i <- i + 1
##
## > draw.plotmath.cell(expression(x > y), i, nr); i <- i + 1
##
## > draw.plotmath.cell(expression(x >= y), i, nr); i <- i + 1
##
## > draw.plotmath.cell(expression(x %~~% y), i, nr); i <- i + 1
##
## > draw.plotmath.cell(expression(x %=~% y), i, nr); i <- i + 1
##
## > draw.plotmath.cell(expression(x %==% y), i, nr); i <- i + 1
##
## > draw.plotmath.cell(expression(x %prop% y), i, nr); i <- i + 1
##
## > draw.plotmath.cell(expression(x %~% y), i, nr); i <- i + 1
##
## > draw.title.cell("Typeface", i, nr); i <- i + 1
##
## > draw.plotmath.cell(expression(plain(x)), i, nr); i <- i + 1
##
## > draw.plotmath.cell(expression(italic(x)), i, nr); i <- i + 1
##
## > draw.plotmath.cell(expression(bold(x)), i, nr); i <- i + 1
##
## > draw.plotmath.cell(expression(bolditalic(x)), i, nr); i <- i + 1
##
## > draw.plotmath.cell(expression(underline(x)), i, nr); i <- i + 1
##
## > # Need fewer, wider columns for ellipsis ...
## > nr <- 20
##
## > nc <- 2
##
## > make.table(nr, nc)
## $mar
## [1] 0 0 0 0
##
## $pty
## [1] "s"
##
##
## > i <- 0
##
## > draw.title.cell("Ellipsis", i, nr); i <- i + 1
##
## > draw.plotmath.cell(expression(list(x[1], ..., x[n])), i, nr); i <- i + 1
##
## > draw.plotmath.cell(expression(x[1] + ... + x[n]), i, nr); i <- i + 1
##
## > draw.plotmath.cell(expression(list(x[1], cdots, x[n])), i, nr); i <- i + 1
##
## > draw.plotmath.cell(expression(x[1] + ldots + x[n]), i, nr); i <- i + 1
##
## > draw.title.cell("Set Relations", i, nr); i <- i + 1
##
## > draw.plotmath.cell(expression(x %subset% y), i, nr); i <- i + 1
##
## > draw.plotmath.cell(expression(x %subseteq% y), i, nr); i <- i + 1
##
## > draw.plotmath.cell(expression(x %supset% y), i, nr); i <- i + 1
##
## > draw.plotmath.cell(expression(x %supseteq% y), i, nr); i <- i + 1
##
## > draw.plotmath.cell(expression(x %notsubset% y), i, nr); i <- i + 1
##
## > draw.plotmath.cell(expression(x %in% y), i, nr); i <- i + 1
##
## > draw.plotmath.cell(expression(x %notin% y), i, nr); i <- i + 1
##
## > draw.title.cell("Accents", i, nr); i <- i + 1
##
## > draw.plotmath.cell(expression(hat(x)), i, nr); i <- i + 1
##
## > draw.plotmath.cell(expression(tilde(x)), i, nr); i <- i + 1
##
## > draw.plotmath.cell(expression(ring(x)), i, nr); i <- i + 1
##
## > draw.plotmath.cell(expression(bar(xy)), i, nr); i <- i + 1
##
## > draw.plotmath.cell(expression(widehat(xy)), i, nr); i <- i + 1
##
## > draw.plotmath.cell(expression(widetilde(xy)), i, nr); i <- i + 1
##
## > draw.title.cell("Arrows", i, nr); i <- i + 1
##
## > draw.plotmath.cell(expression(x %<->% y), i, nr); i <- i + 1
##
## > draw.plotmath.cell(expression(x %->% y), i, nr); i <- i + 1
##
## > draw.plotmath.cell(expression(x %<-% y), i, nr); i <- i + 1
##
## > draw.plotmath.cell(expression(x %up% y), i, nr); i <- i + 1
##
## > draw.plotmath.cell(expression(x %down% y), i, nr); i <- i + 1
##
## > draw.plotmath.cell(expression(x %<=>% y), i, nr); i <- i + 1
##
## > draw.plotmath.cell(expression(x %=>% y), i, nr); i <- i + 1
##
## > draw.plotmath.cell(expression(x %<=% y), i, nr); i <- i + 1
##
## > draw.plotmath.cell(expression(x %dblup% y), i, nr); i <- i + 1
##
## > draw.plotmath.cell(expression(x %dbldown% y), i, nr); i <- i + 1
##
## > draw.title.cell("Symbolic Names", i, nr); i <- i + 1
##
## > draw.plotmath.cell(expression(Alpha - Omega), i, nr); i <- i + 1
##
## > draw.plotmath.cell(expression(alpha - omega), i, nr); i <- i + 1
##
## > draw.plotmath.cell(expression(phi1 + sigma1), i, nr); i <- i + 1
##
## > draw.plotmath.cell(expression(Upsilon1), i, nr); i <- i + 1
##
## > draw.plotmath.cell(expression(infinity), i, nr); i <- i + 1
##
## > draw.plotmath.cell(expression(32 * degree), i, nr); i <- i + 1
##
## > draw.plotmath.cell(expression(60 * minute), i, nr); i <- i + 1
##
## > draw.plotmath.cell(expression(30 * second), i, nr); i <- i + 1
##
## > # Need even fewer, wider columns for typeface and style ...
## > nr <- 20
##
## > nc <- 1
##
## > make.table(nr, nc)
## $mar
## [1] 0 0 0 0
##
## $pty
## [1] "s"
##
##
## > i <- 0
##
## > draw.title.cell("Style", i, nr); i <- i + 1
##
## > draw.plotmath.cell(expression(displaystyle(x)), i, nr); i <- i + 1
##
## > draw.plotmath.cell(expression(textstyle(x)), i, nr); i <- i + 1
##
## > draw.plotmath.cell(expression(scriptstyle(x)), i, nr); i <- i + 1
##
## > draw.plotmath.cell(expression(scriptscriptstyle(x)), i, nr); i <- i + 1
##
## > draw.title.cell("Spacing", i, nr); i <- i + 1
##
## > draw.plotmath.cell(expression(x ~~ y), i, nr); i <- i + 1
##
## > # Need fewer, taller rows for fractions ...
## > # cheat a bit to save pages
## > par(new = TRUE)
##
## > nr <- 10
##
## > nc <- 1
##
## > make.table(nr, nc)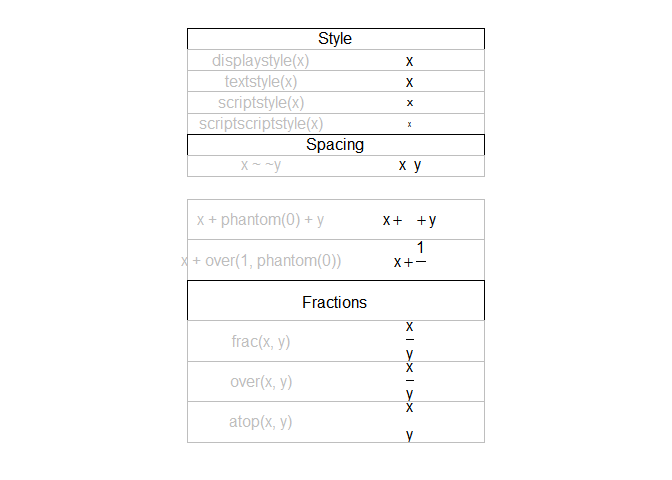
## $mar
## [1] 0 0 0 0
##
## $pty
## [1] "s"
##
##
## > i <- 4
##
## > draw.plotmath.cell(expression(x + phantom(0) + y), i, nr); i <- i + 1
##
## > draw.plotmath.cell(expression(x + over(1, phantom(0))), i, nr); i <- i + 1
##
## > draw.title.cell("Fractions", i, nr); i <- i + 1
##
## > draw.plotmath.cell(expression(frac(x, y)), i, nr); i <- i + 1
##
## > draw.plotmath.cell(expression(over(x, y)), i, nr); i <- i + 1
##
## > draw.plotmath.cell(expression(atop(x, y)), i, nr); i <- i + 1
##
## > # Need fewer, taller rows and fewer, wider columns for big operators ...
## > nr <- 10
##
## > nc <- 1
##
## > make.table(nr, nc)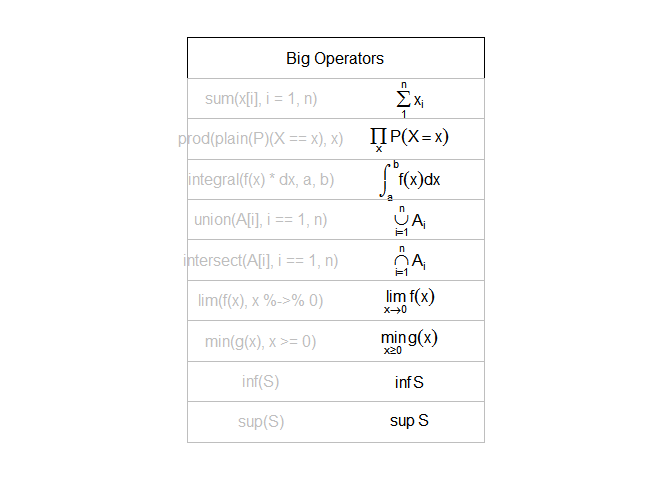
## $mar
## [1] 0 0 0 0
##
## $pty
## [1] "s"
##
##
## > i <- 0
##
## > draw.title.cell("Big Operators", i, nr); i <- i + 1
##
## > draw.plotmath.cell(expression(sum(x[i], i=1, n)), i, nr); i <- i + 1
##
## > draw.plotmath.cell(expression(prod(plain(P)(X == x), x)), i, nr); i <- i + 1
##
## > draw.plotmath.cell(expression(integral(f(x) * dx, a, b)), i, nr); i <- i + 1
##
## > draw.plotmath.cell(expression(union(A[i], i==1, n)), i, nr); i <- i + 1
##
## > draw.plotmath.cell(expression(intersect(A[i], i==1, n)), i, nr); i <- i + 1
##
## > draw.plotmath.cell(expression(lim(f(x), x %->% 0)), i, nr); i <- i + 1
##
## > draw.plotmath.cell(expression(min(g(x), x >= 0)), i, nr); i <- i + 1
##
## > draw.plotmath.cell(expression(inf(S)), i, nr); i <- i + 1
##
## > draw.plotmath.cell(expression(sup(S)), i, nr); i <- i + 1
##
## > make.table(nr, nc)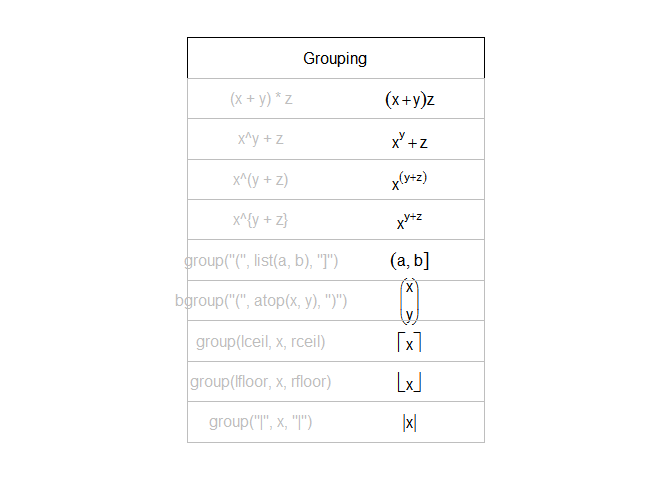
## $mar
## [1] 0 0 0 0
##
## $pty
## [1] "s"
##
##
## > i <- 0
##
## > draw.title.cell("Grouping", i, nr); i <- i + 1
##
## > draw.plotmath.cell(expression((x + y)*z), i, nr); i <- i + 1
##
## > draw.plotmath.cell(expression(x^y + z), i, nr); i <- i + 1
##
## > draw.plotmath.cell(expression(x^(y + z)), i, nr); i <- i + 1
##
## > # have to do this one by hand
## > draw.plotmath.cell(expression(x^{y + z}), i, nr, string="x^{y + z}"); i <- i + 1
##
## > draw.plotmath.cell(expression(group("(", list(a, b), "]")), i, nr); i <- i + 1
##
## > draw.plotmath.cell(expression(bgroup("(", atop(x, y), ")")), i, nr); i <- i + 1
##
## > draw.plotmath.cell(expression(group(lceil, x, rceil)), i, nr); i <- i + 1
##
## > draw.plotmath.cell(expression(group(lfloor, x, rfloor)), i, nr); i <- i + 1
##
## > draw.plotmath.cell(expression(group("|", x, "|")), i, nr); i <- i + 1
##
## > par(oldpar)
#環境内に導入されているパッケージのデモが可能な一覧が表示される
demo(package = .packages(all.available = TRUE))example
引数の関数のサンプルコードが実行される。
example(rep)##
## rep> rep(1:4, 2)
## [1] 1 2 3 4 1 2 3 4
##
## rep> rep(1:4, each = 2) # not the same.
## [1] 1 1 2 2 3 3 4 4
##
## rep> rep(1:4, c(2,2,2,2)) # same as second.
## [1] 1 1 2 2 3 3 4 4
##
## rep> rep(1:4, c(2,1,2,1))
## [1] 1 1 2 3 3 4
##
## rep> rep(1:4, each = 2, len = 4) # first 4 only.
## [1] 1 1 2 2
##
## rep> rep(1:4, each = 2, len = 10) # 8 integers plus two recycled 1's.
## [1] 1 1 2 2 3 3 4 4 1 1
##
## rep> rep(1:4, each = 2, times = 3) # length 24, 3 complete replications
## [1] 1 1 2 2 3 3 4 4 1 1 2 2 3 3 4 4 1 1 2 2 3 3 4 4
##
## rep> rep(1, 40*(1-.8)) # length 7 on most platforms
## [1] 1 1 1 1 1 1 1
##
## rep> rep(1, 40*(1-.8)+1e-7) # better
## [1] 1 1 1 1 1 1 1 1
##
## rep> ## replicate a list
## rep> fred <- list(happy = 1:10, name = "squash")
##
## rep> rep(fred, 5)
## $happy
## [1] 1 2 3 4 5 6 7 8 9 10
##
## $name
## [1] "squash"
##
## $happy
## [1] 1 2 3 4 5 6 7 8 9 10
##
## $name
## [1] "squash"
##
## $happy
## [1] 1 2 3 4 5 6 7 8 9 10
##
## $name
## [1] "squash"
##
## $happy
## [1] 1 2 3 4 5 6 7 8 9 10
##
## $name
## [1] "squash"
##
## $happy
## [1] 1 2 3 4 5 6 7 8 9 10
##
## $name
## [1] "squash"
##
##
## rep> # date-time objects
## rep> x <- .leap.seconds[1:3]
##
## rep> rep(x, 2)
## [1] "1972-07-01 09:00:00 JST" "1973-01-01 09:00:00 JST"
## [3] "1974-01-01 09:00:00 JST" "1972-07-01 09:00:00 JST"
## [5] "1973-01-01 09:00:00 JST" "1974-01-01 09:00:00 JST"
##
## rep> rep(as.POSIXlt(x), rep(2, 3))
## [1] "1972-07-01 09:00:00 JST" "1972-07-01 09:00:00 JST"
## [3] "1973-01-01 09:00:00 JST" "1973-01-01 09:00:00 JST"
## [5] "1974-01-01 09:00:00 JST" "1974-01-01 09:00:00 JST"
##
## rep> ## named factor
## rep> x <- factor(LETTERS[1:4]); names(x) <- letters[1:4]
##
## rep> x
## a b c d
## A B C D
## Levels: A B C D
##
## rep> rep(x, 2)
## a b c d a b c d
## A B C D A B C D
## Levels: A B C D
##
## rep> rep(x, each = 2)
## a a b b c c d d
## A A B B C C D D
## Levels: A B C D
##
## rep> rep.int(x, 2) # no names
## [1] A B C D A B C D
## Levels: A B C D
##
## rep> rep_len(x, 10)
## [1] A B C D A B C D A B
## Levels: A B C Dvignette
パッケージ全体の説明や関数をどのように使うかを詳細な文書として提供する。
#library(dplyr)
vignette(package="dplyr")
Vignettes in package ‘dplyr’:
new-sql-backend Adding a new SQL backend (source, html)
data_frames Data frames (source, html)
databases Databases (source, html)
hybrid-evaluation Hybrid evaluation (source, html)
introduction Introduction to dplyr (source, html)
nse Non-standard evaluation (source, html)
two-table Two-table verbs (source, html)
window-functions Window functions and grouped mutate/filter (source, html)
最終更新日:2016/04/27
copyrigth © 2016 r-beginners.com All rigths reserved.
PAGE TOP ▲